What is Code Coverage & How to Calculate It? +6 Tips to Get Started
Did you know that the average code coverage across industries falls between 74% to 76%?


Code coverage is a software testing metric that measures how much of your source code is executed when running automated tests.
A percentage helps developers identify areas of the application that have been tested and those that have not yet been tested. Many experts recommend 75-80% coverage, with tech giants like Google considering 60% acceptable, 75% commendable, and 90% exemplary.
A higher coverage percentage can provide confidence that your application has been thoroughly tested, reducing the risk of untested bugs making their way into production.
However, effective testing isn’t just about hitting a number. Code coverage only measures execution, not tests' quality or ability to catch real-world failures. Achieving high coverage is possible without testing the most critical edge cases.
The best approach to code coverage is to focus on the most important parts of your code. Prioritise areas that affect performance, security, and user experience.
This article will walk you through everything you need to know about code coverage, from how it’s calculated to the different types of coverage, best practices for setting realistic goals, and how to integrate it into your testing workflow.
In the end, you'll have a clear, actionable strategy for using code coverage effectively so that your software is more reliable, maintainable, and well-tested.
What is Code Coverage?
Code coverage is a key software testing metric that helps measure how much of your code has been tested.
It calculates the percentage of your codebase executed when running test cases, making it easier to identify any untested or potentially risky areas.
When delivering a software product, both developers and clients expect high quality. That doesn’t just mean the application works but also performs well, behaves as expected, remains secure, and is easy to maintain.
Code coverage is important in assessing these factors by giving insight into how thoroughly the software has been tested.
A higher code coverage generally means fewer chances of missing critical issues. This isn't the only way to gauge the quality of your software, but it's useful for determining the amount of testing your software has received.
To calculate code coverage, you can use the following formula:
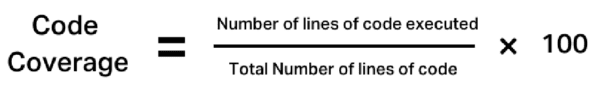
How Code Coverage is Calculated
Code coverage is an essential metric in white-box testing that measures how much of the source code is executed when a test suite runs. A well-covered application can still have undetected bugs if the tests are not meaningful.
Each type of code coverage serves a different purpose when assessing test completeness. Let’s break them down with formulas and examples to understand how they work.
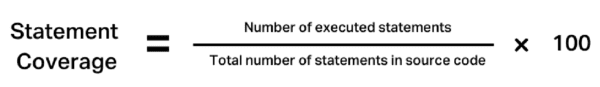
1. Statement Coverage
Statement coverage ensures that every executable statement in the code runs at least once. It helps detect unused code, missing statements, and dead code.
Example: Calculating Statement Coverage

Scenario 1: Input (num = 4)
The function calculates result = 4 * 2 = 8
The condition if (result > 10) evaluates false, so the “Small number” message prints.
- Executed statements: 5
- Total statements: 7
Statement Coverage= 5/7 x 100 = 71%
Scenario 2: Input (num = 6)
The function calculates result = 6 * 2 = 12
The condition if (result > 10) evaluates true, so the “Big number” message prints.
- Executed statements: 6
- Total statements: 7
Statement Coverage= 6/7 x 100 = 85%
Since both scenarios together ensure every line is executed at least once, the overall statement coverage reaches 100%.
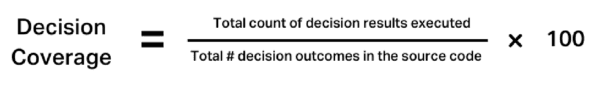
2. Decision Coverage
Decision coverage, also known as branch coverage, ensures that every decision point (if-else, loops, switches) in the code is tested for both true and false outcomes.
Example: Calculating Decision Coverage

Test Scenarios & Calculation:
ScenarioInput aOutcomeDecision Coverage13No (condition false, multiplication skipped)50% (Only "No" tested)27Yes (condition true, multiplication executed)100% (Both Yes and No tested)
- Scenario 1 (a = 3): Only the false (No) branch executes. Coverage = 50%
- Scenario 2 (a = 7): The true (Yes) branch executes as well, covering both paths. Coverage = 100%
To achieve 100% decision coverage, both true and false outcomes of every decision must be tested.
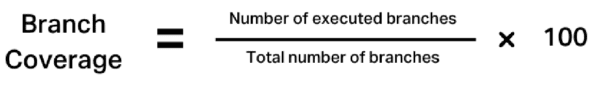
3. Branch Coverage
Branch coverage ensures that each possible branch (true/false) of every decision point is executed at least once.
Example: Calculating Branch Coverage

Test CasePrice InputOutputDecision CoverageBranch Coverage150No Discount!50%33%2150Discount Applied!100%67%
Branch coverage ensures that all logical paths—including loops and decision structures—are tested.
4. Condition Coverage
Condition coverage evaluates each logical condition inside a decision statement rather than just the overall decision outcome.
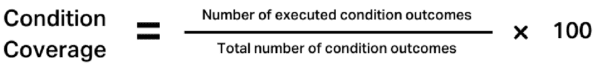
Example: Calculating Condition Coverage

X > YB > AOutputCondition CoverageTT✅25%FF❌50%TF❌75%FT❌100%
Condition coverage ensures each part of a condition is tested separately, which is especially useful for complex boolean expressions.
5. Function Coverage
Function coverage measures how many functions were executed at least once during testing. It helps ensure that all core functionalities are tested.
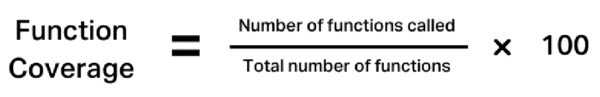
Example: Calculating Function Coverage

- Total functions: 4
- Executed functions: 3 (divide() was not tested)
Function Coverage= 3/4 x 100 = 75%
With 75% function coverage, most of the core functionalities are tested, but the divide function remains untested. If there’s a bug in the divide() method (such as incorrect division logic or an unhandled exception for divide(5,0)), it would go unnoticed until runtime.
6. Line Coverage
Line coverage calculates how many lines of code were executed during testing, including comments and empty lines.
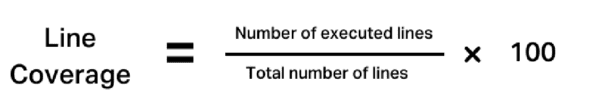
Example: Calculating Line Coverage

- Total lines of code: 4
- Lines executed in testing: 3 (The else statement was not executed)
Line Coverage= 3/4 x 100 = 75%
The 75% line coverage indicates that while most of the program ran, the edge case where log(null) is passed was never tested. This could lead to unexpected behavior or crashes in production if a log(null) ever occurs.
Code Coverage Testing Tools
Code coverage testing tools measure the effectiveness of tests by identifying which parts of the codebase are executed during testing.
They help uncover untested portions of the code, improving test quality and software reliability. Let's take a look at different types of code coverage tools:
Unit Test Coverage Tools
These tools determine how much of the codebase is executed by unit tests. These tools focus on the smallest units of code, such as functions or methods.
Among the most popular unit test coverage tools are:
JaCoCo
JaCoCo is an open-source code coverage tool for Java that integrates with build tools like Maven, Gradle, and Ant.
It provides detailed reports, including branch, line, and method coverage, making it a popular choice for Java developers.
Example: To integrate JaCoCo into a Maven project, you can add the following plugin configuration to your pom.xml:

This configuration prepares the JaCoCo agent before tests run and generates a coverage report after tests are complete.
After running your tests with Maven (mvn test), the coverage report will be available at target/site/jacoco/index.html.
Coverage.py
Coverage.py is a tool for measuring code coverage of Python programs. It monitors your program, noting which parts of the code have been executed, and then analyzes the source to identify code that could have been executed but was not.
It's widely used in conjunction with testing frameworks like unittest and pytest.
Example:
- Install the necessary packages:
pip install coverage pytest - Run your tests with coverage:
coverage run -m pytest - Generate a coverage report:
coverage report -m
This sequence runs your tests and displays a coverage report in the terminal. For a more detailed, HTML-based report, you can generate it using coverage html.
The HTML report will be available in the htmlcov directory.
Integration Test Coverage Tools
These tools evaluate how different components of the software interact during integration tests, ensuring that modules work together as expected. A few of the most popular integration test coverage tools are:
Clover
Clover is a code coverage tool that provides test coverage analysis for Java and Groovy applications. It integrates with various build tools and IDEs, offering detailed coverage reports to help developers identify untested parts of their codebase.
Example: To use Clover with an Ant build script, you can define the Clover tasks and set up the instrumentation and reporting as follows:

This configuration sets up Clover to instrument your code, run the tests, and generate an HTML coverage report.
Bullseye Coverage
Bullseye Coverage is a code coverage tool for C and C++ applications. It's particularly useful for integration testing in embedded systems and provides detailed coverage analysis to ensure thorough testing of complex codebases.
Example:
- Instrument the code:
cov01 -1 - Compile the instrumented code:
g++ -o test_program test_program.cpp - Run the instrumented program:
cov01 -c ./test_program - Generate the coverage report:
cov01 -s
This sequence instruments your code, compiles it, runs the tests, and generates a coverage report.
Coverage Analysis Tools
These tools provide comprehensive analysis by collecting and visualizing data from various types of tests, generating detailed reports and metrics to help teams improve test effectiveness. A few of the most popular coverage analysis tools include:
Cobertura (Java Coverage Tool)
Cobertura is an open-source code coverage tool for Java that analyzes code coverage and generates reports in formats like HTML and XML.
It's often used in legacy Java projects and integrates well with continuous integration tools like Jenkins.
Example: To integrate Cobertura with an Ant build script, you can define the Cobertura tasks and set up the instrumentation and reporting as follows:

Code Coverage Benefits
Code coverage isn’t just about hitting numbers. It's about building better, more reliable software while making life easier for developers and testers. Here’s how it helps
More Confidence in Your Code
Knowing which parts of your code are tested (and which aren’t) helps you catch potential problem areas before they cause real trouble.
When developers can identify gaps in test coverage, they can fix issues early, leading to fewer bugs and a more reliable product.
Faster, More Efficient Testing
Instead of testing everything randomly, code coverage lets you focus on the most important parts of your code.
That means less wasted time, more efficient testing, and faster releases—all without cutting corners on quality.
Stronger Trust in Your Software
When a large portion of your code is covered by tests, it gives developers, testers, and stakeholders peace of mind.
You have now test results to prove that your software works. That means fewer surprises in production and a smoother experience for users.
Lower Costs & Fewer Production Issues
Fixing bugs after a release can be expensive and frustrating. Code coverage helps you catch problems early, so they don’t turn into costly maintenance headaches later.
By finding and fixing issues before deployment, you save time, money, and stress.
Better Team Collaboration
When teams track and share code coverage insights, everyone stays on the same page. Developers, testers, and other stakeholders can work together to close testing gaps, making the entire process more effective and less chaotic.
At the end of the day, code coverage isn’t just a number—it’s a tool that helps teams build higher-quality software, work more efficiently, and reduce long-term costs.
6 Tips to Get Started
Getting started with code coverage can feel overwhelming, but it doesn’t have to be. Code coverage is a great way to measure how much of your code is tested, but it’s important to use it wisely.
Here are six practical tips to help you get started the right way.
1. Find Right Tool for Your Project
Different programming languages have different tools for generating coverage reports. Choosing the right one can make your life easier.
Here are some popular options:
- Java: Atlassian Clover, Cobertura, JaCoCo
- JavaScript: Istanbul
- PHP: PHPUnit
- Python: Coverage.py
- Ruby: SimpleCov
Some tools show results directly in your terminal, while others generate detailed HTML reports that let you explore which parts of your code lack coverage.
If you’re unsure which tool to pick, try comparing features to see which one fits your workflow best.
2. Set a Code Coverage Target
There’s no magic number for code coverage. Even if you hit 100% coverage, that doesn’t guarantee your tests are meaningful or effective.
A commonly accepted benchmark is 80% coverage, as it strikes a balance between thorough testing and development efficiency.
If you’re just starting out with testing, don’t stress over a low percentage. The rush to achieve 80% or higher may lead to bad testing habits, such as writing tests that only increase coverage without checking if the code works.
Instead, focus on writing meaningful tests that align with your application's business logic.
For example, imagine testing a function that checks if a number is a multiple of 10. You could reach 100% coverage by testing numbers like 100 and 34, but what happens if you pass a letter instead of a number?
Should the function return false or throw an exception? Code coverage won’t tell you if you’re missing these important cases, so think from a user’s perspective, not just a coverage goal.
3. Begin with Unit Testing
If you want a quick way to increase your code coverage, start with unit tests. Unit testing checks individual functions or methods to ensure they work as expected. They are easy to implement, fast to run and provide a great foundation for testing.
By covering the core logic of your application with unit tests, you’ll naturally improve your coverage without writing unnecessary tests.
4. Use Coverage Reports to Spot Gaps in Testing
Once your test suite grows, you won’t be able to manually track what’s been tested. That’s where coverage reports come in handy. They let you:
- Pinpoint areas of your code that aren’t tested
- Identify critical gaps in testing
- Ensure that key features are covered
Instead of blindly adding more tests, use coverage reports to focus on what really matters—testing the parts of your application that could fail in real-world scenarios.
5. Integrate Code Coverage into Your CI/CD Pipeline
Once your team has a solid testing process, you can integrate code coverage into your Continuous Integration (CI) workflow.
It means setting coverage thresholds (e.g., if coverage drops below 70%, the build fails), ensuring new code meets the required coverage before merging, and maintaining a robust testing culture.
Be cautious with setting overly strict thresholds. If you set a failure threshold at 90%, your builds may fail too often, causing frustration.
A safer approach is setting an 80% goal but allowing a 70% threshold, giving developers some flexibility while maintaining quality.
However, don’t make coverage a strict requirement without context.
6. Good Coverage ≠ Good Tests
It’s easy to think that high coverage means your tests are solid, but that’s not always true. Code coverage tools show what code is executed, but they don’t measure test quality.
A great test suite doesn’t just ensure that lines of code are executed—it also checks that the application behaves correctly in real-world scenarios.
Your tests should verify expected outcomes, handle unexpected inputs gracefully, and cover both success and failure cases to ensure reliable software behavior.
Think of code coverage as a helpful guide, not the ultimate goal. Aim for meaningful tests that catch real bugs, rather than just trying to hit a specific percentage.
Final Thoughts
Code coverage is a useful tool for identifying untested code, but blindly chasing high coverage metrics can backfire. As highlighted in the Optivem Journal, rigid coverage targets often encourage gaming the system—writing assertion-free tests or wrapping code in try/catch blocks just to hit a percentage.
High coverage alone doesn’t guarantee software quality. It measures execution, not test effectiveness, leading teams to waste time on tests that don’t catch real defects.
Instead of focusing on numbers, teams should prioritize test effectiveness. A strong testing strategy includes behavior-driven unit tests, integration tests, exploratory testing, and real-world scenario validation.
Mutation testing, using tools like PITest (Java) and Stryker (JavaScript), helps ensure tests catch actual bugs rather than just executing code.
Organizations should measure success through defect rates, system stability, and user experience, rather than arbitrary coverage percentages.
This is where Testlio helps. Unlike traditional automation tools that simply track coverage, Testlio focuses on real-world testing to ensure software functions as intended.
By combining automated and human-driven testing, Testlio uncovers issues that coverage metrics alone miss.
It integrates seamlessly into CI/CD pipelines across mobile, web, and APIs, enabling continuous testing while reducing unnecessary test inflation and maintenance costs.