The Mobile QA Metrics That Help You Ship Better
For many engineering leads and executives, reviewing quality assurance dashboards and automation reports may feel like trying to solve a complex puzzle, one where the pieces keep changing, and the full picture only comes into focus after it’s too late.


They are presented with execution graphs, test pass rates, open vs. closed bugs, velocity charts, and even device matrices. All meticulously color-coded. All updated in real-time. Data noise steals the “intelligence” from business intelligence, and decisions are made more based on feeling and extra abstraction work for this data, than the data itself.
And yet, the real questions are still unanswered. Is the product user-friendly? Does our testing cover all the code, or is some code in the code base still untested? Dashboards create the illusion of knowledge and focus on internal activity rather than external impact.
Metrics like “tests run” or “bugs closed” look impressive, but they don’t reflect the lived experience of a user in a different region, on a different device, with real business on the line.
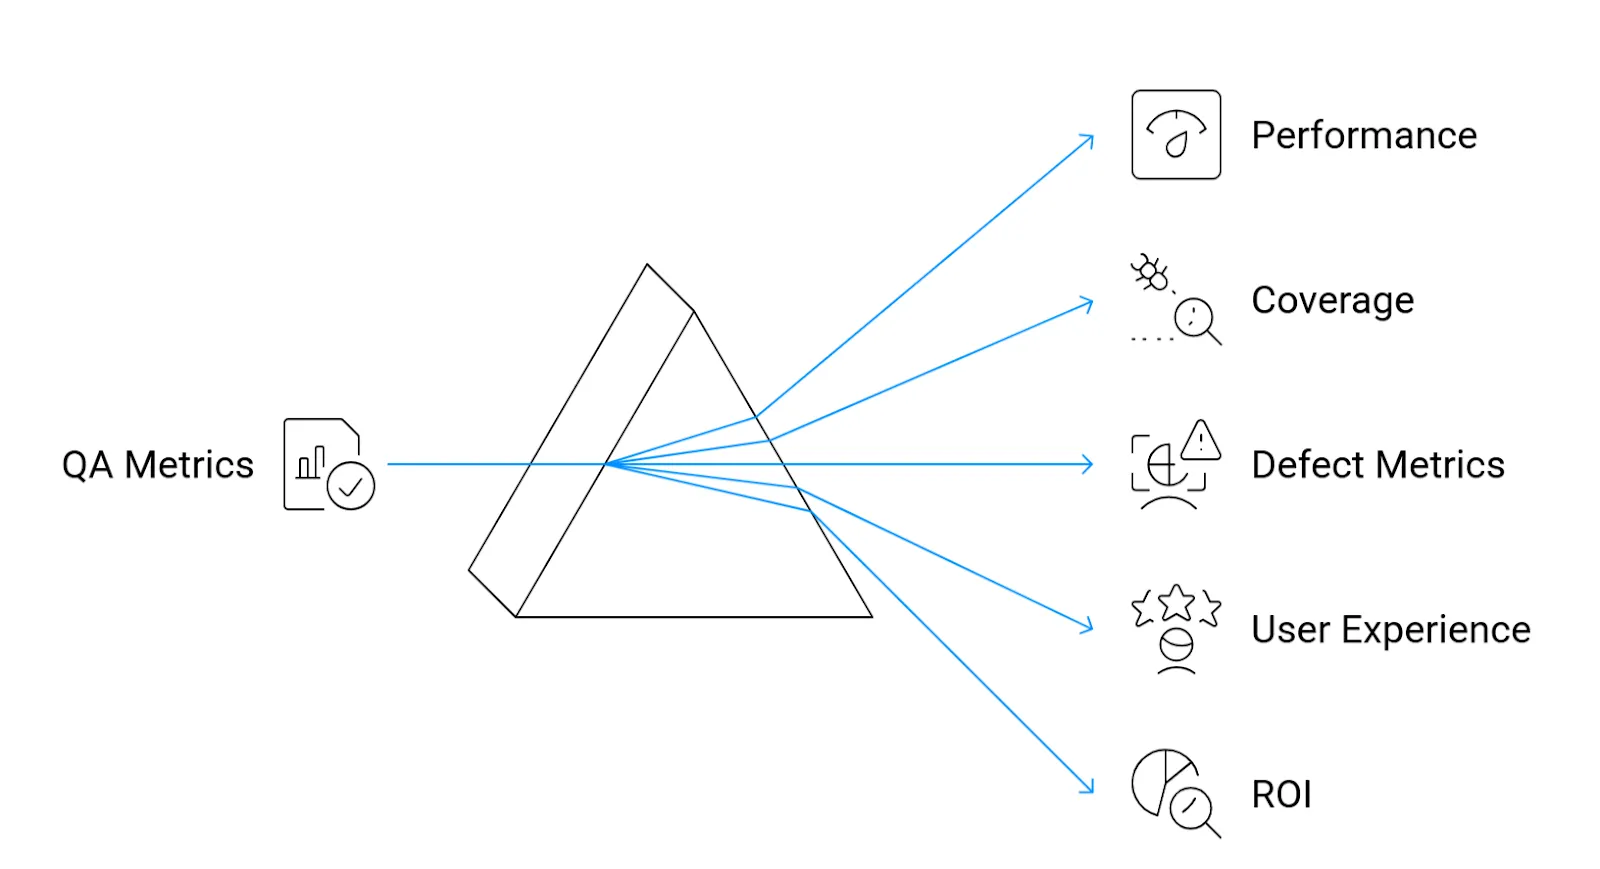
VPs don’t need more metrics; instead, they need the right ones. Metrics that go beyond test activity and tie directly to performance, coverage, user experience (UX), and return on investment (ROI). Metrics that reflect how real users experience the product, and whether the team is truly ready to ship.
This blog covers those metrics in detail and how they can be utilized effectively in testing.
TL; DR:
- Most QA dashboards are filled with vanity metrics, which are useless to engineering executives.
- The five QA metrics that matter most are: Performance, Coverage, Defects, User Experience, and ROI. Each helps guide smarter release and investment decisions.
- Crowdsourced QA platforms like Testlio help fill gaps in scale, devices, and regions, boosting quality and coverage.
What Leaders Need from QA Metrics (And What They Don’t)
Imagine you're preparing for a major product release. The QA dashboard lights up green:
- Over 1,500 test cases executed
- 96% pass rate
- No open critical bugs
- Regression testing suite completed across top devices
From a process standpoint, everything is on track. However, a few days after release, customer complaints spike. Users report crashes on mid-range Android devices in Southeast Asia. A checkout button fails on specific iOS versions. A web app is not in sync with the mobile app version. App store ratings fall. The release technically passed, but practically failed.
This is the gap between QA activity and QA effectiveness. And sometimes, this leads to waste in terms of resources, efforts, and money.
Most QA dashboards today are designed to serve engineering teams, not business leaders. As a result, they tend to emphasize internal effort rather than external outcomes.
Let’s break down what executive stakeholders and technical leads actually need from QA metrics and what they don’t.
What They Expect from QA Reports
Executives, engineering leads and other high-level stakeholders like VP’s don’t need to know the internal mechanics of every component and the details of every bug found; they need the right indicators that the business is going in the right direction.
Here’s what those “indicators” look like in quality assurance of mobile applications:
- Risk-based summaries
They do not just need pass/fail; they want to know: What are the riskiest areas? Are there any blockers on key devices or user flows? That’s the red flag they need to act on. - Customer-impact visibility
Business leads look for answers to questions like, does this release affect the current customer base by providing a practical user experience and performance?. - Coverage intelligence
This includes evaluating the percentage of code coverage and test case coverage in functional automation. Do the test cases cover the entire user base from different regions? This isn’t just a metric, it’s a business risk. - Trends over time
Executives, program managers and leads expect QA reports to indicate how this release compares to the last one. The trends over time, such as whether we are leaking fewer defects, and whether app store ratings are rising or falling post-release, help them understand the team's effectiveness. - Clarity and brevity
One clean page with visuals and color-coded status goes further than 10 different dashboards indicating different metrics. VPs want signals, not noise. - Indicators Analysis and Recommendations
Indicators by themselves should be a way to support actions, decisions, and insights, but adding some quick analysis and actionable recommendations is the glue that adds consistency and coherence to them.
What They Don’t Want in QA Reports
Again, our leads and executives don't need metrics and reports that don't help in making business decisions or evaluating business value. These metrics include:
- Test case execution stats (e.g., “345/360 passed”)
These numbers don’t mean much without context. A high pass rate means nothing if the 15 failed tests affect login and payments. - Generic bug counts (“42 bugs filed this week”)
Bug quantity doesn’t guarantee quality. What matters is which bugs, where they are, and if any are still open on production paths. - Automation coverage by itself (“78% of test cases automated”)
This feels like progress, but it can be misleading. An engineering executive needs answers to questions like, 'Are we automating the flows that crash most often, or just the easy ones?' - QA team activities (e.g., test cases written, hours logged)
They’re not directly measuring QA effort; they’re measuring product readiness.
Mobile QA Metrics That Actually Matter: The Five Metrics Pillars
Now that we have discussed the expectations of VPs from QA reports, let's examine what those QA reports look like.
An effective QA report contains metrics that answer questions about the product quality rather than testing quality. For example, System test completion time is a metric that indicates the quality and velocity of testing, but the number of app crashes indicates product quality.
These crucial quality metrics can be categorized into five major quality pillars. Let's discuss each one in detail:
a. Performance
Performance metrics encompass all factors that contribute to evaluating the application's performance under load. These metrics are essential because they are directly linked to user retention. Users will not be incentivized to stick around using an app that takes 10 seconds to load fully.
Performance degradation leads to user drop-off and negative reviews, ultimately resulting in business loss.
The following metrics are critical when it comes to the performance testing of mobile applications:
- Crash rate: The percentage of sessions that end in a crash.
- ARN (Application Not Responding): The percentage of sessions with the application hanging on or being slow to process data inputs and outputs. ANRs are separate from crashes, as not all ANRs may end in a crash.
- App load times: The time it takes for a component to load and become usable.
- Network latency and API response times: The total time taken for API calls to receive a complete response from the backend.
Sometimes, this pillar may be split into Reliability/Availability, especially for mission-critical applications like payment systems. For that, sometimes an internal SLA is crafted based on the following:
- Uptime: The percentage of a fully functioning system's availability, usually in hours over a period of days
- Concurrent Sessions: The number of actual/projected concurrent sessions that the system may have at any point. This is important for media & streaming, gaming and other mission critical applications as it may allow for timely decision-making regarding capacity increase/decrease and the related investments.
b. Coverage
Coverage metrics are vital for assessing what exactly the test suite tests. They ensure that the QA effort reflects the actual needs regarding devices, regions, OS, languages, screen resolutions, screen sizes, and versions of the market you are targeting. Gaps in coverage mean that real users will encounter errors that were missed during testing.
To evaluate coverage, the following metrics should be calculated:
- Test coverage: What percentage of the code, UI, and features have been tested?
- Device/OS coverage: What devices and operating systems has the app been tested on? Are we even testing on what the consumers use?
- Regional coverage: Accounting for different geographies, i.e., testing with local languages, payment methods, currencies, time zones, etc.
- Code coverage: How much of our code is hit when the system test suite is executed?
c. Defect Metrics
Defect metrics are crucial for analyzing QA output in terms of business risk and determining whether testing efforts are on the right track. Issues such as defect leakage and unresolved severe bugs can lead to significant business losses after production.
When it comes to analyzing a mobile application’s defects, the following metrics are important:
- Defect density: The number of bugs per module/story, or feature.
- Defect leakage: The number of bugs found after production release. (Escaped bugs/defects)
- Fix rate: The percentage of found bugs that were resolved
- Defect severity: The number of critical and high-severity bugs that have a high business cost.
d. User Experience
User mood and feedback are determined by evaluating user experience metrics. These metrics help teams determine if current business flows, logic, and experience satisfy customers and keep them engaged.
If you want to know whether users are satisfied with your application, take a look at the following metrics:
- App store rating: Ratings for the application on online app stores and marketplaces.
- User feedback: User comments and feedback on online app stores and forums.
- User retention rate: Percentage of users who keep using an application for a specific time after downloading it.
- Conversion rate: Percentage of users on an application who complete a desired action.
e. ROI
ROI provides executives with an indication of whether their investment in quality is yielding a return on investment. These metrics are essential because they prove that investment in quality is a value multiplier.
The following metrics will help you gain an idea regarding the return on investment of your testing efforts:
- Release velocity: How quickly are you shipping features?
- Cost savings: Savings in the form of loss prevented through early detection and triaging of critical bugs.
- Cost of Quality (CoQ): The cost incurred on testing to ensure quality.
Now that we have discussed the critical metrics for mobile app testing, let's move towards analyzing how they can be leveraged for maximum benefit.
Making Mobile QA Metrics Actionable
Once the right QA metrics are collected for mobile testing, the next critical step is to translate them into actionable insights. This includes collecting data points regarding the test strategy, taking action on code quality, and mapping these metrics to user trust and business success.
This is achieved by examining the metrics as a navigation system, guiding release decisions, prioritization, and resource allocation across teams.
The following are a few questions that the high-level stakeholders and leads should ask the teams to get the most out of mobile application testing metrics:
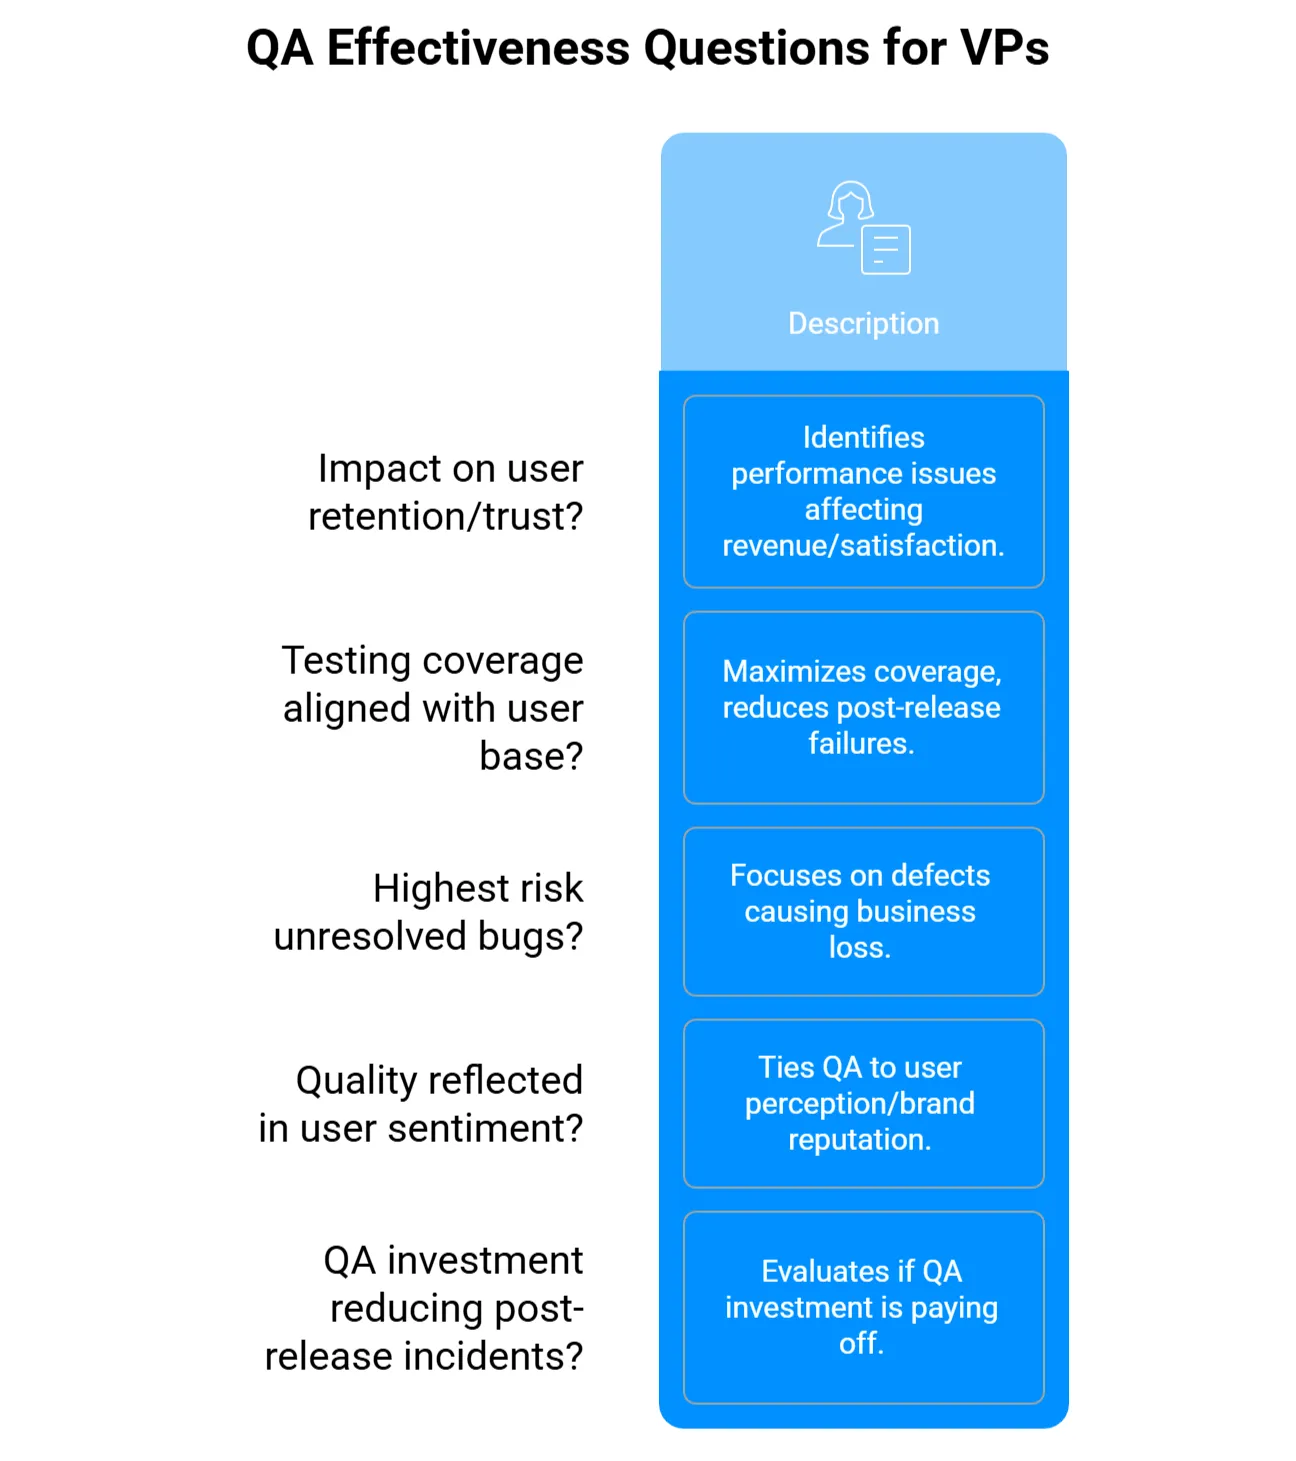
- Are current crash rates and load times impacting user retention or user trust? This helps identify where poor performance is directly affecting revenue and user satisfaction. It enables the prioritization of fixes in the most critical markets and platforms.
- Are we testing on the same devices, OS versions, and regions that represent the majority of our user base? To maximize coverage, VPs and leads should ask the teams whether testing efforts align with actual usage patterns. This reduces the risk of post-release failures in production environments.
- Which unresolved bugs present the highest risk to core business user flows? Engineering and business leads require answers and progress updates, particularly regarding defects that result in business losses. Effective bug triage is crucial for addressing issues that have the most significant impact on business outcomes, enabling teams to prioritize business needs effectively.
- Is quality improving in a way that’s reflected in app store ratings and user sentiment? This question directly ties QA effectiveness to user perception and brand reputation, helping leaders understand whether technical improvements are aligning with user needs.
- Is our investment in QA reducing post-release incidents and lowering the total cost of quality over time? VPs should evaluate whether the QA investment is paying off. To do this, they assess whether financial returns support decisions around scaling, tooling, or partnering for QA.
Apart from the above five actions, the right dashboarding is crucial for identifying action items based on QA metrics. The right dashboard answers questions like: What’s broken, where, and how severe is the issue?
It connects test results to business-critical flows, displaying charts over time, flagging unmet release criteria, and prioritizing issues by severity and user impact.
Most importantly, it empowers VPs to make informed go/no-go calls quickly, confidently, and without needing to dig.
When (and Why) to Bring in Crowdsourced QA Experts
In-house teams often lack the global reach, localization testing, and device diversity necessary for effective product development. Take, for example, a payment module that does not charge shipping fees in a few currencies. When users from unsupported regions attempt to use the app, they are unable to complete the checkout process. This causes frustration, business loss, and numerous support tickets.
During post-mortem analysis, it becomes clear that the test suite lacked scenarios for region-specific currencies. The in-house QA team had validated significant flows but missed this critical case because they simply didn’t have the coverage, devices, or real-world context to simulate it.
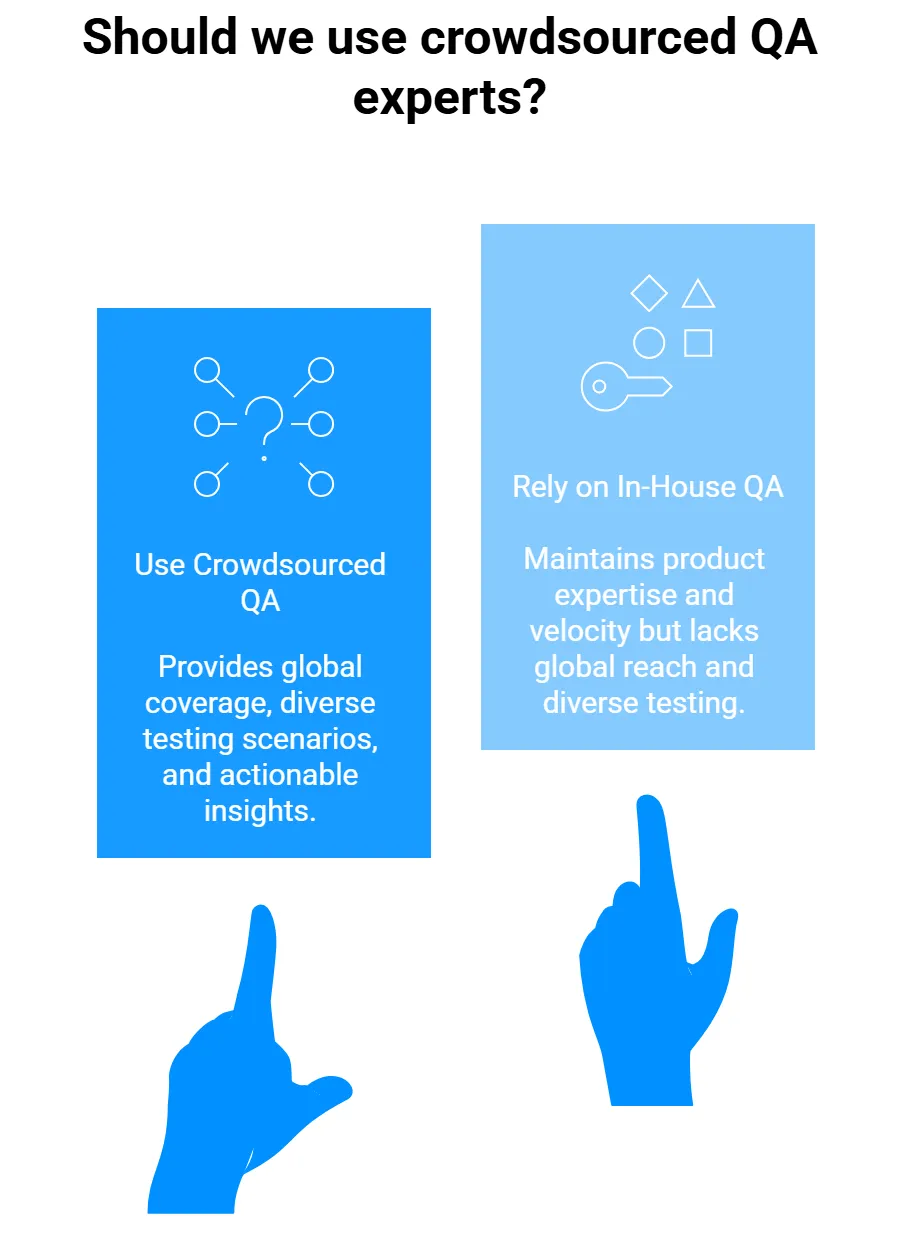
This is a classic example of where in-house QA teams meet their limits. While they have expertise in understanding the product and maintaining velocity, they’re constrained by the availability of devices, geographic reach, time zones, and testing bandwidth.
For globally deployed software, this is not just a quality gap; it’s a business risk.
Even if the internal team had identified this case, incorporating it into the test suite would have significantly increased test execution time, putting delivery timelines at risk.
How do crowdsourced QA teams help?
Crowdsourced QA communities, such as Testlio, can deliver strategic value by tapping into a global network of real testers on real devices in real-world conditions. These QA teams provide valuable input by covering the following areas:
- Testing of edge cases across multiple currencies, languages, and geographies.
- Payment testing on a wide matrix of device, OS combinations, and local bank cards.
- Simulating usage under variable network conditions, power constraints, or biometric logins.
- Providing meaningful dashboards with actionable insights for VPs.
Discover how Testlio’s crowd testing teams integrated localization and payment testing for a retail company in this case study.
To integrate crowdsourced testing effectively, align it with your existing dashboards and KPIs. Set measurable goals to analyze both the positive and negative impacts. For example:
- Performance: Track reductions in crash rates and load time issues captured by crowdsourced testers, especially on real devices and networks in target regions.
- Coverage: Measure the increase in device, OS, and regional test coverage achieved through crowdsourced efforts compared to in-house capabilities.
- Defects: Monitor the number and severity of critical bugs uncovered exclusively by crowdsourced testing, with a focus on those affecting high-revenue or high-risk flows.
- User Experience: Assess improvements in app store ratings, user feedback scores, and reduced complaints tied to usability or localization issues found by external testers.
- ROI: Evaluate decreases in customer-found defects and support ticket count to enhance pre-release coverage from crowdsourced QA.
Final Thoughts
It is time to take a hard look at your current QA metrics and ask yourself: Which truly belong in the five pillars of Performance, Coverage, Defects, User Experience, and ROI, and which are simply noise cluttering your dashboards?
The real challenge is aligning your QA scorecard to measurable business outcomes. Once that alignment is achieved, use it to reassess your testing strategy and QA partner mix, ensuring every metric drives meaningful decisions and delivers real impact.
This is where Testlio can make a difference.
By providing access to a global network of expert testers and real devices, Testlio helps you fill coverage gaps, accelerate release cycles, and connect testing efforts directly to business outcomes.